Today I presented a Microsoft Reactor session on How to Elevate your documentation with PowerShell Jupyter Notebook. This session provided;
- an introduction to ‘What is Jupyter Notebook”
- a quick start guide
- some advanced examples showing mixed HTML, JavaScript and PowerShell Notebook and Charts / Graphs
- how to create your own PowerShell Jupyter Notebook environments
For those that attended the session, the presentation is embedded at the end of this post.
Other links from the How to Elevate your documentation with PowerShell Jupyter Notebook session;
- getting started with Local PowerShell Jupyter Notebook.
- containerizing PowerShell Jupyter Notebook with Docker.
I’ve also uploaded to GitHub GIST and embedded below my example notebooks shown during the presentation demos.
The YouTube recording of the presentation is now available here.
Graph Recent Azure AD SignIns
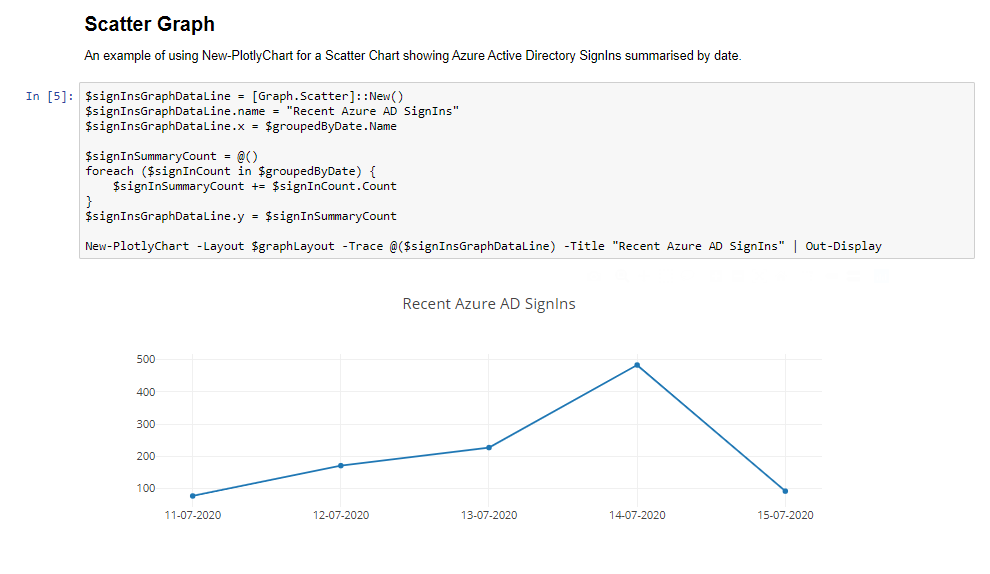
The following example notebook (below the graph output images) showed how to get the most recent 1000 Azure AD SignIns from a small Azure AD Tenant, summarize them by day and graph them.
A Bar Graph example from an Azure AD SignIns PowerShell Jupyter Notebook example.

A Scatter Graph example from an Azure AD SignIns PowerShell Jupyter Notebook example.

Graphing Azure AD SignIns – PowerShell Jupyter Notebook
Getting Creative with PowerShell and Jupyter Notebook
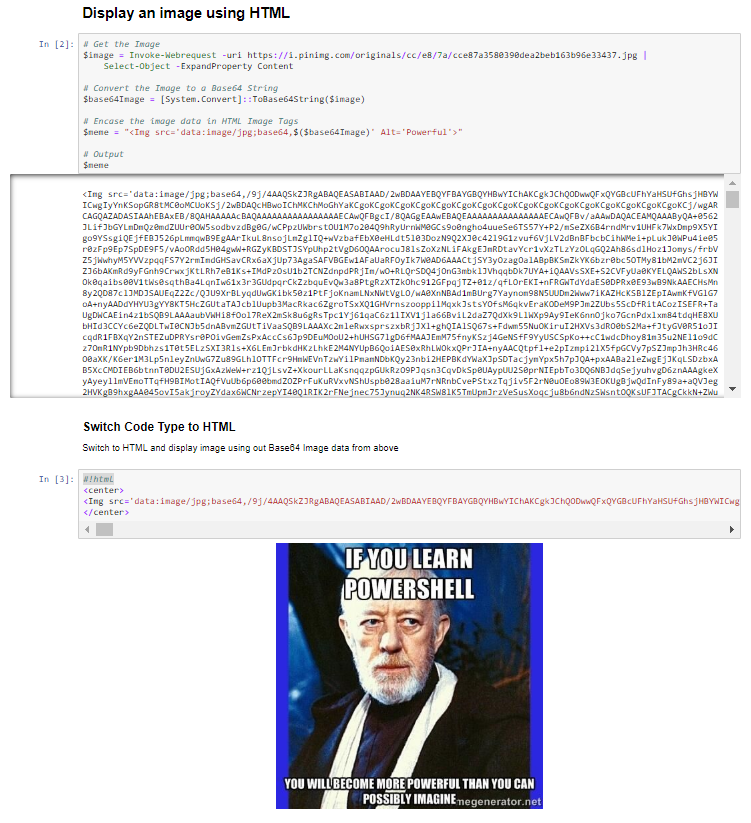
The following example notebook (below the output screenshot images) shows some creative possibilities using PowerShell that may assist for interesting and engaging documentation.
Get an Image from a URL and Display it using Markdown

Get an Image from a URL and Display it using HTML
A variation on the example above. Get an image using a WebRequest and convert the image to Base64, enclose it in HTML Image tags and display using HTML.

Font Awesome and Emoji’s
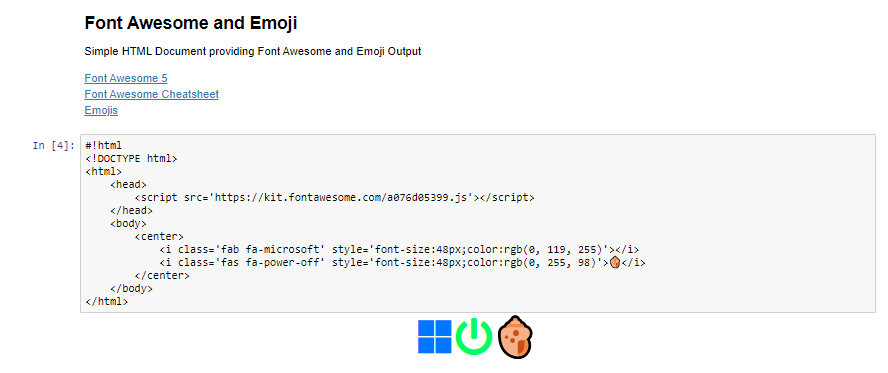
Documentation is always better with Font Awesome and Emoji’s. This example shows how to retrieve and embed Font Awesome icons and Emoji’s in a PowerShell Jupyter Notebook.

Coloured Output
In this example I show how to generate a Mandelbrot with PowerShell to show that colored output makes for interesting eye catching content.

ASCII Art
There’s a time and place for everything and you could argue that ASCII Art has had its time. But it’s still an option when everything old is new again.

Formatting PowerShell Tables as HTML Tables
The last example shows getting data using PowerShell and converting it to HTML with a simple stylesheet to make it prettier and the displaying it in the Jupyter Notebook using HTML and an iFrame.

Creative Documentation Examples – PowerShell Jupyter Notebook
Presentation
Here is the PowerPoint Presentation that incorporated the content above.


