Introduction
I’ve been experimenting and messing around with IoT devices for well over 10 years. Back then it wasn’t called IoT, and it was very much a build it and write it yourself approach.
Fast forward to 2017 and you can buy a microprocessor for a couple of dollars that includes WiFi. Environmental sensors are available for another couple of dollars and we can start to publish environmental telemetry without having to build circuitry and develop code. And rather than having to design and deploy a database to store the telemetry (as I was doing 10+ years ago) we can send it to SaaS/PaaS services and build dashboards very quickly.
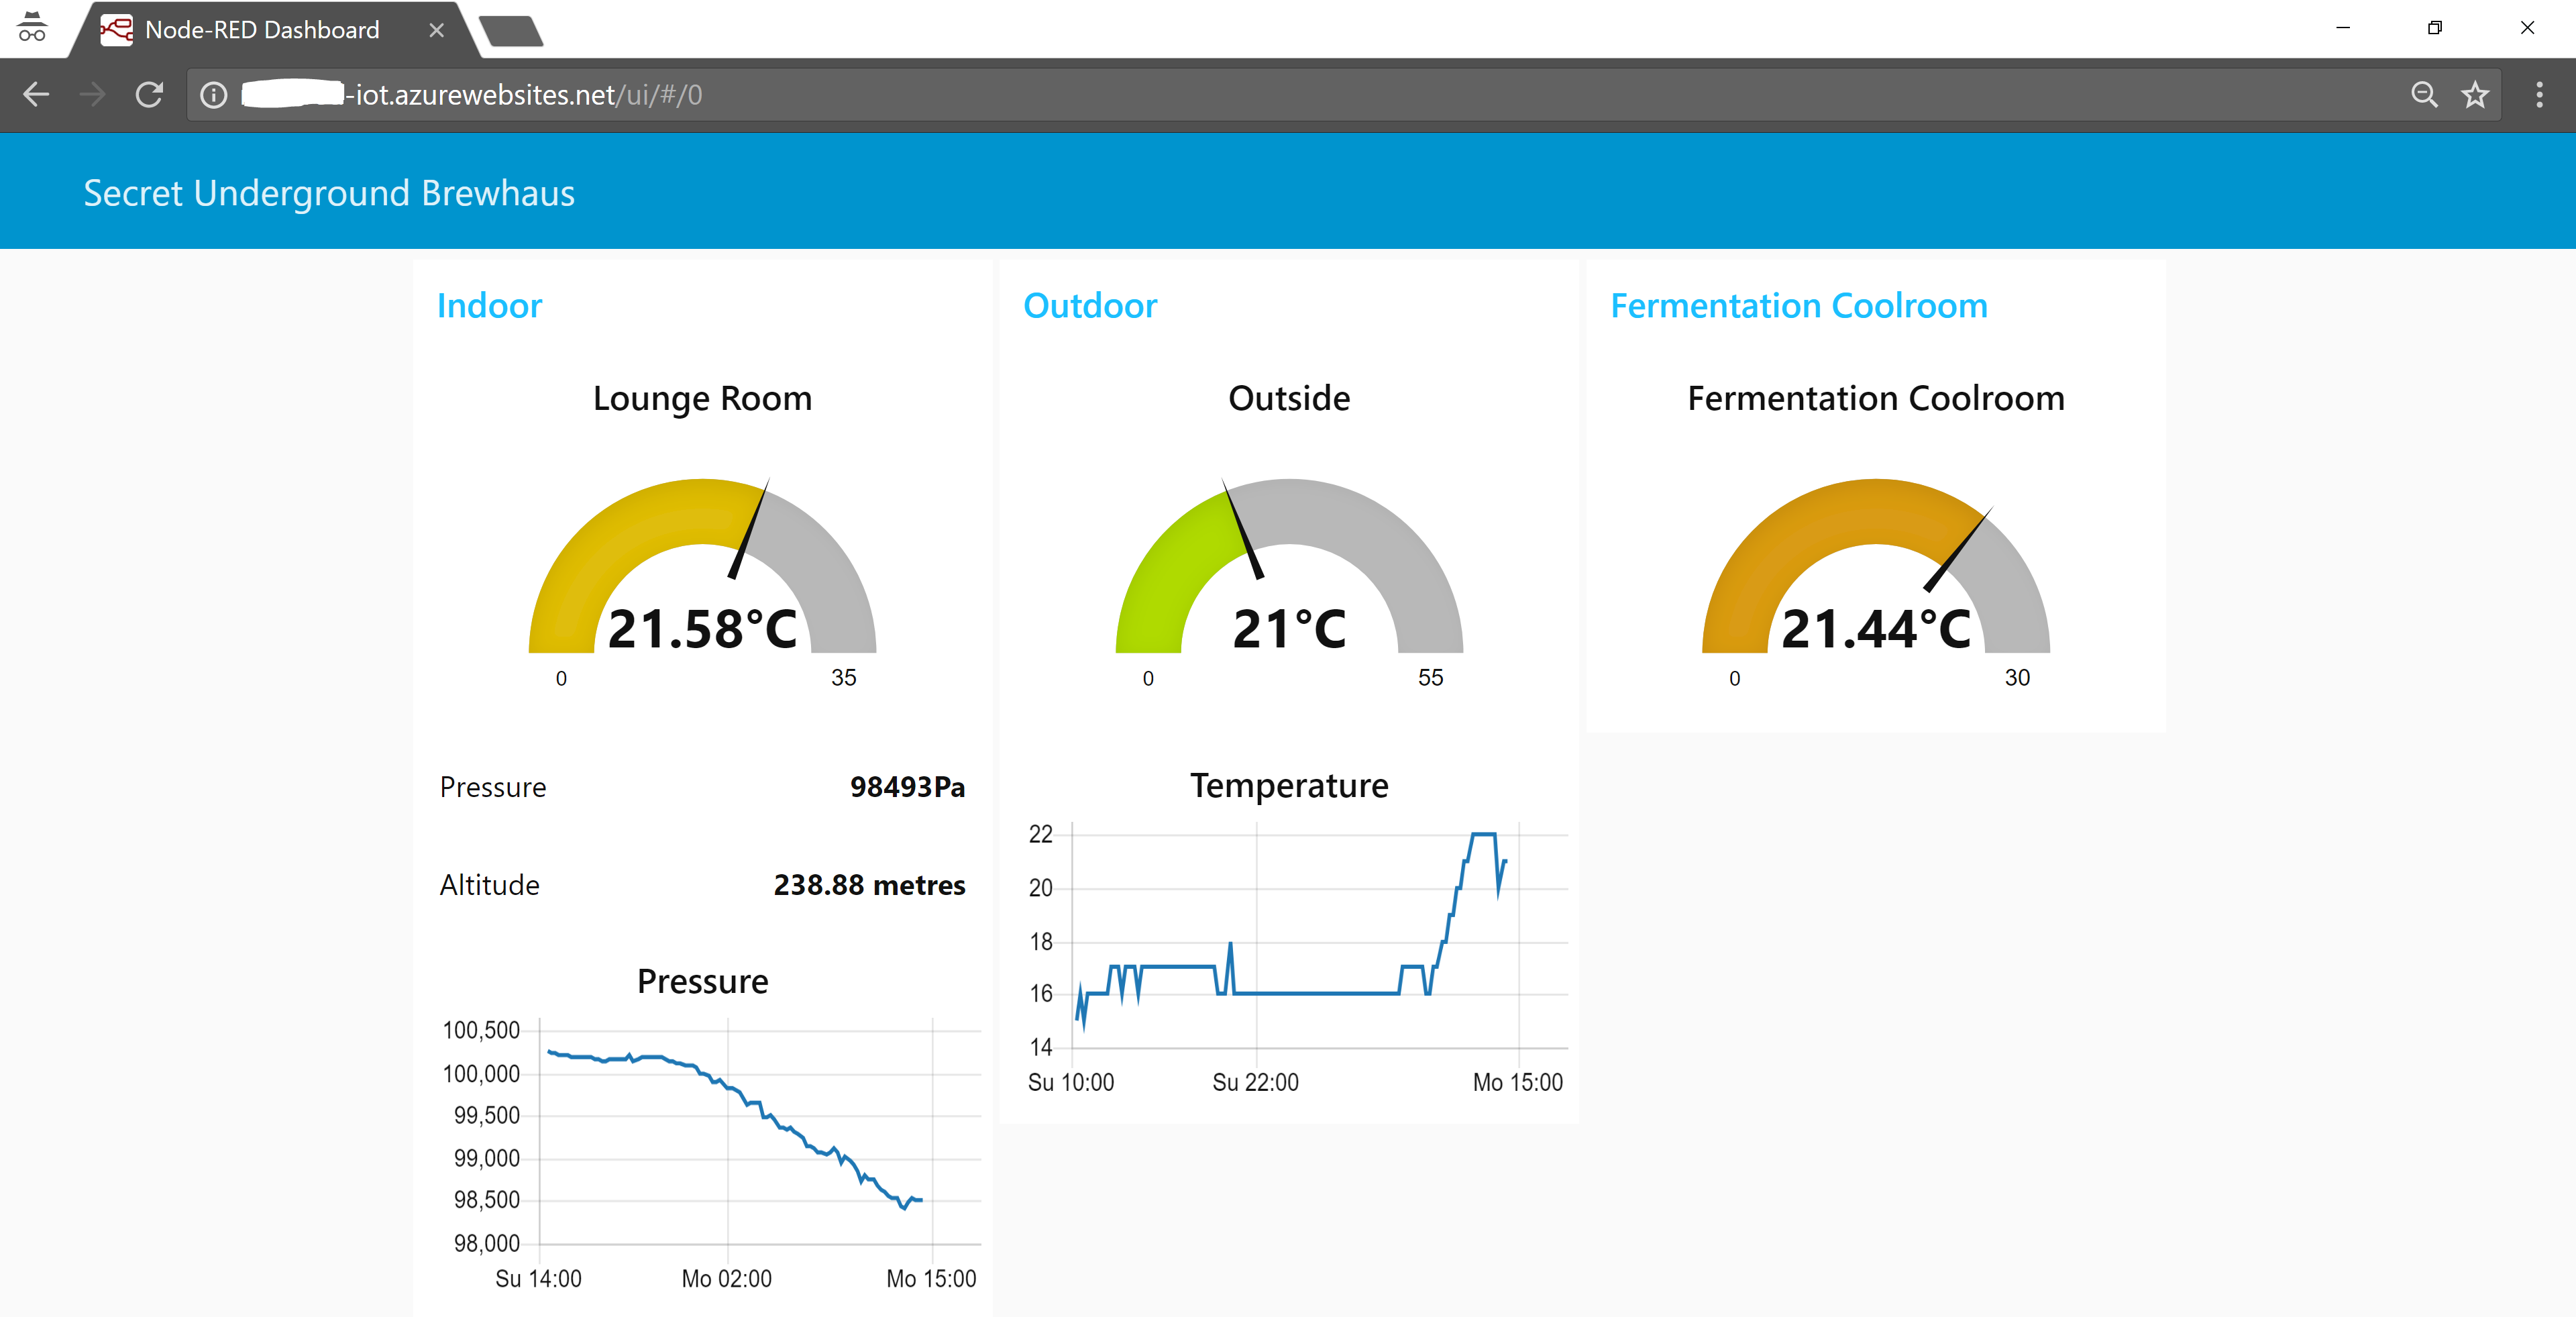
This post provides a quick start guide to those last few points. Visualising data from IoT devices using Azure Platform-as-a-Service services. Here is a rudimentary environment dashboard I put together very quickly.
Overview
Having played with numerous services recently for my already API integrated IoT devices, I knew I wanted a solution to visualise the data, but I didn’t want to deploy dedicated infrastructure and I wanted to keep the number of moving parts to a minimum. I looked at getting my devices to publish their telemetry via MQTT which is great solution (for scale or rapidly changing data), but when you are only dealing with a handful of sensors and data that isn’t highly dynamic it is over-kill. I wanted to simply poll the devices as required and obtain the current readings and visualise it. Think temperature, pressure, humidity.
Through my research I like the look of Node-RED for its quick and simplistic approach to obtaining data and manipulating it for presentation. Node-RED relies on NodeJS which I figured I could deploy as an Azure WebApp (similar to what I did here). Sure enough I could. However not long after I got it working I discovered this project. A Node-RED enabled NodeJS Web App you can deploy straight from Github. Awesome work Juan Manuel Servera.
Prerequisites
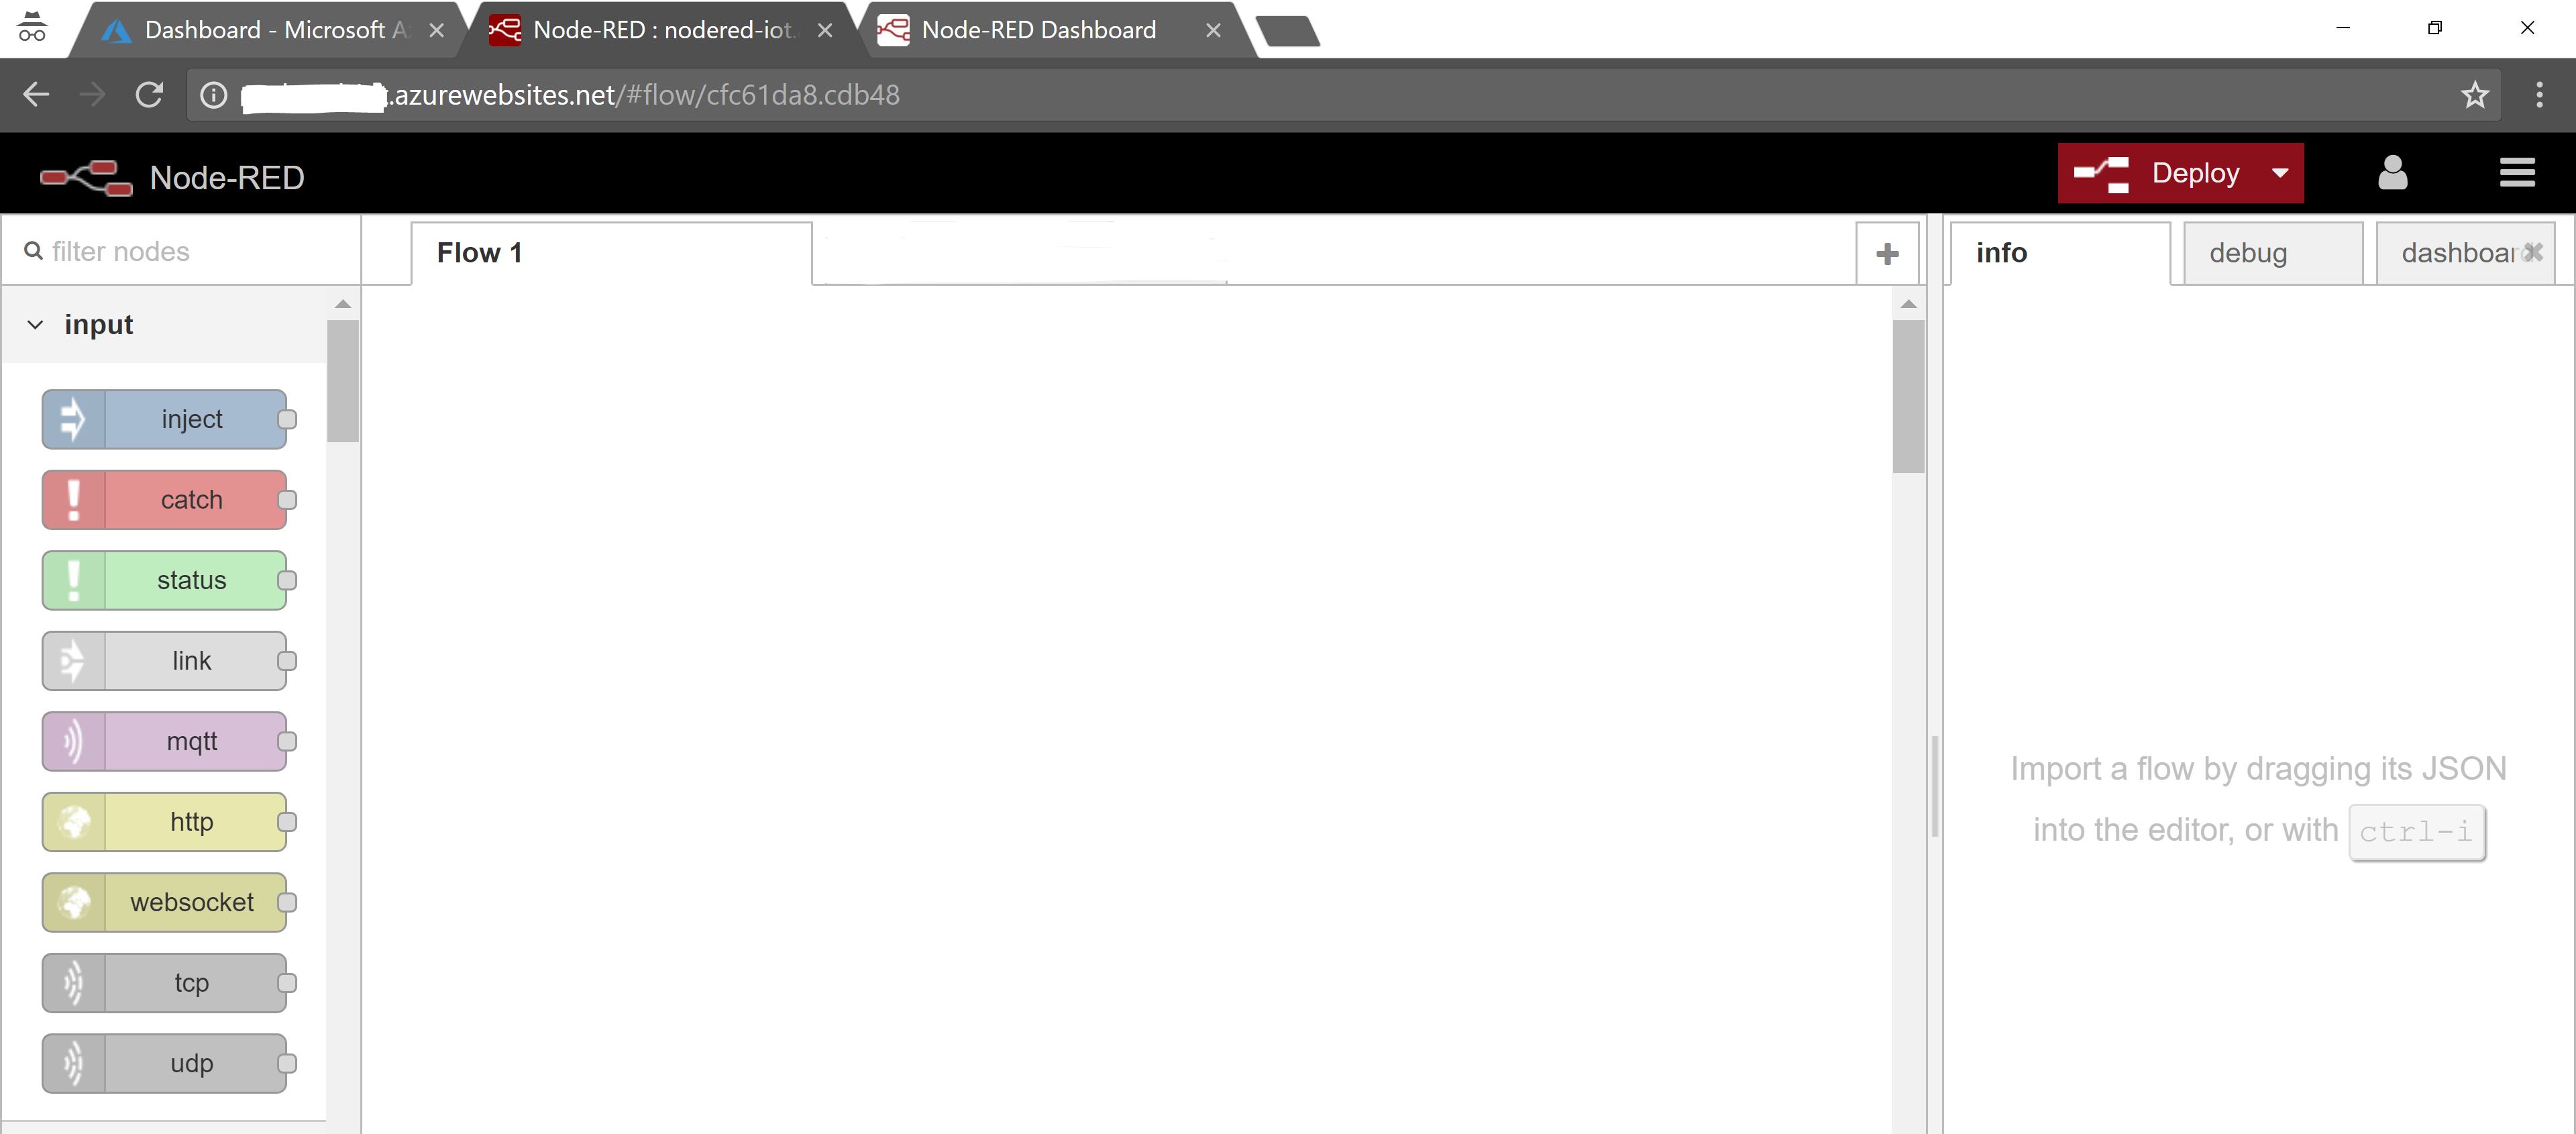
The quickest way to start then is to use Juan’s Azure WebApp wrapper for Node-RED. Follow his instructions to get that deployed to your Azure Subscription. Once deployed you can navigate to your Node-RED WebApp and you should see something similar to the image below.
The first thing you need to do is secure the app. From your WebApp Application Settings in the Azure Portal, use Kudu to navigate to the WebApp files. Under your wwwroot/WebApp directory you will find the settings.js file. Select the file and select the Edit (pencil) icon.

Comment in the adminAuth section around lines 93-100. To generate the encrypted password on a local install of NodeJS I ran the following command and copied the hash. Change ‘whatisagoodpassword’ for your desired password.
node -e "console.log(require('bcryptjs').hashSync(process.argv[1], 8));" whatisagoodpassword
Select Save, then Restart your application.

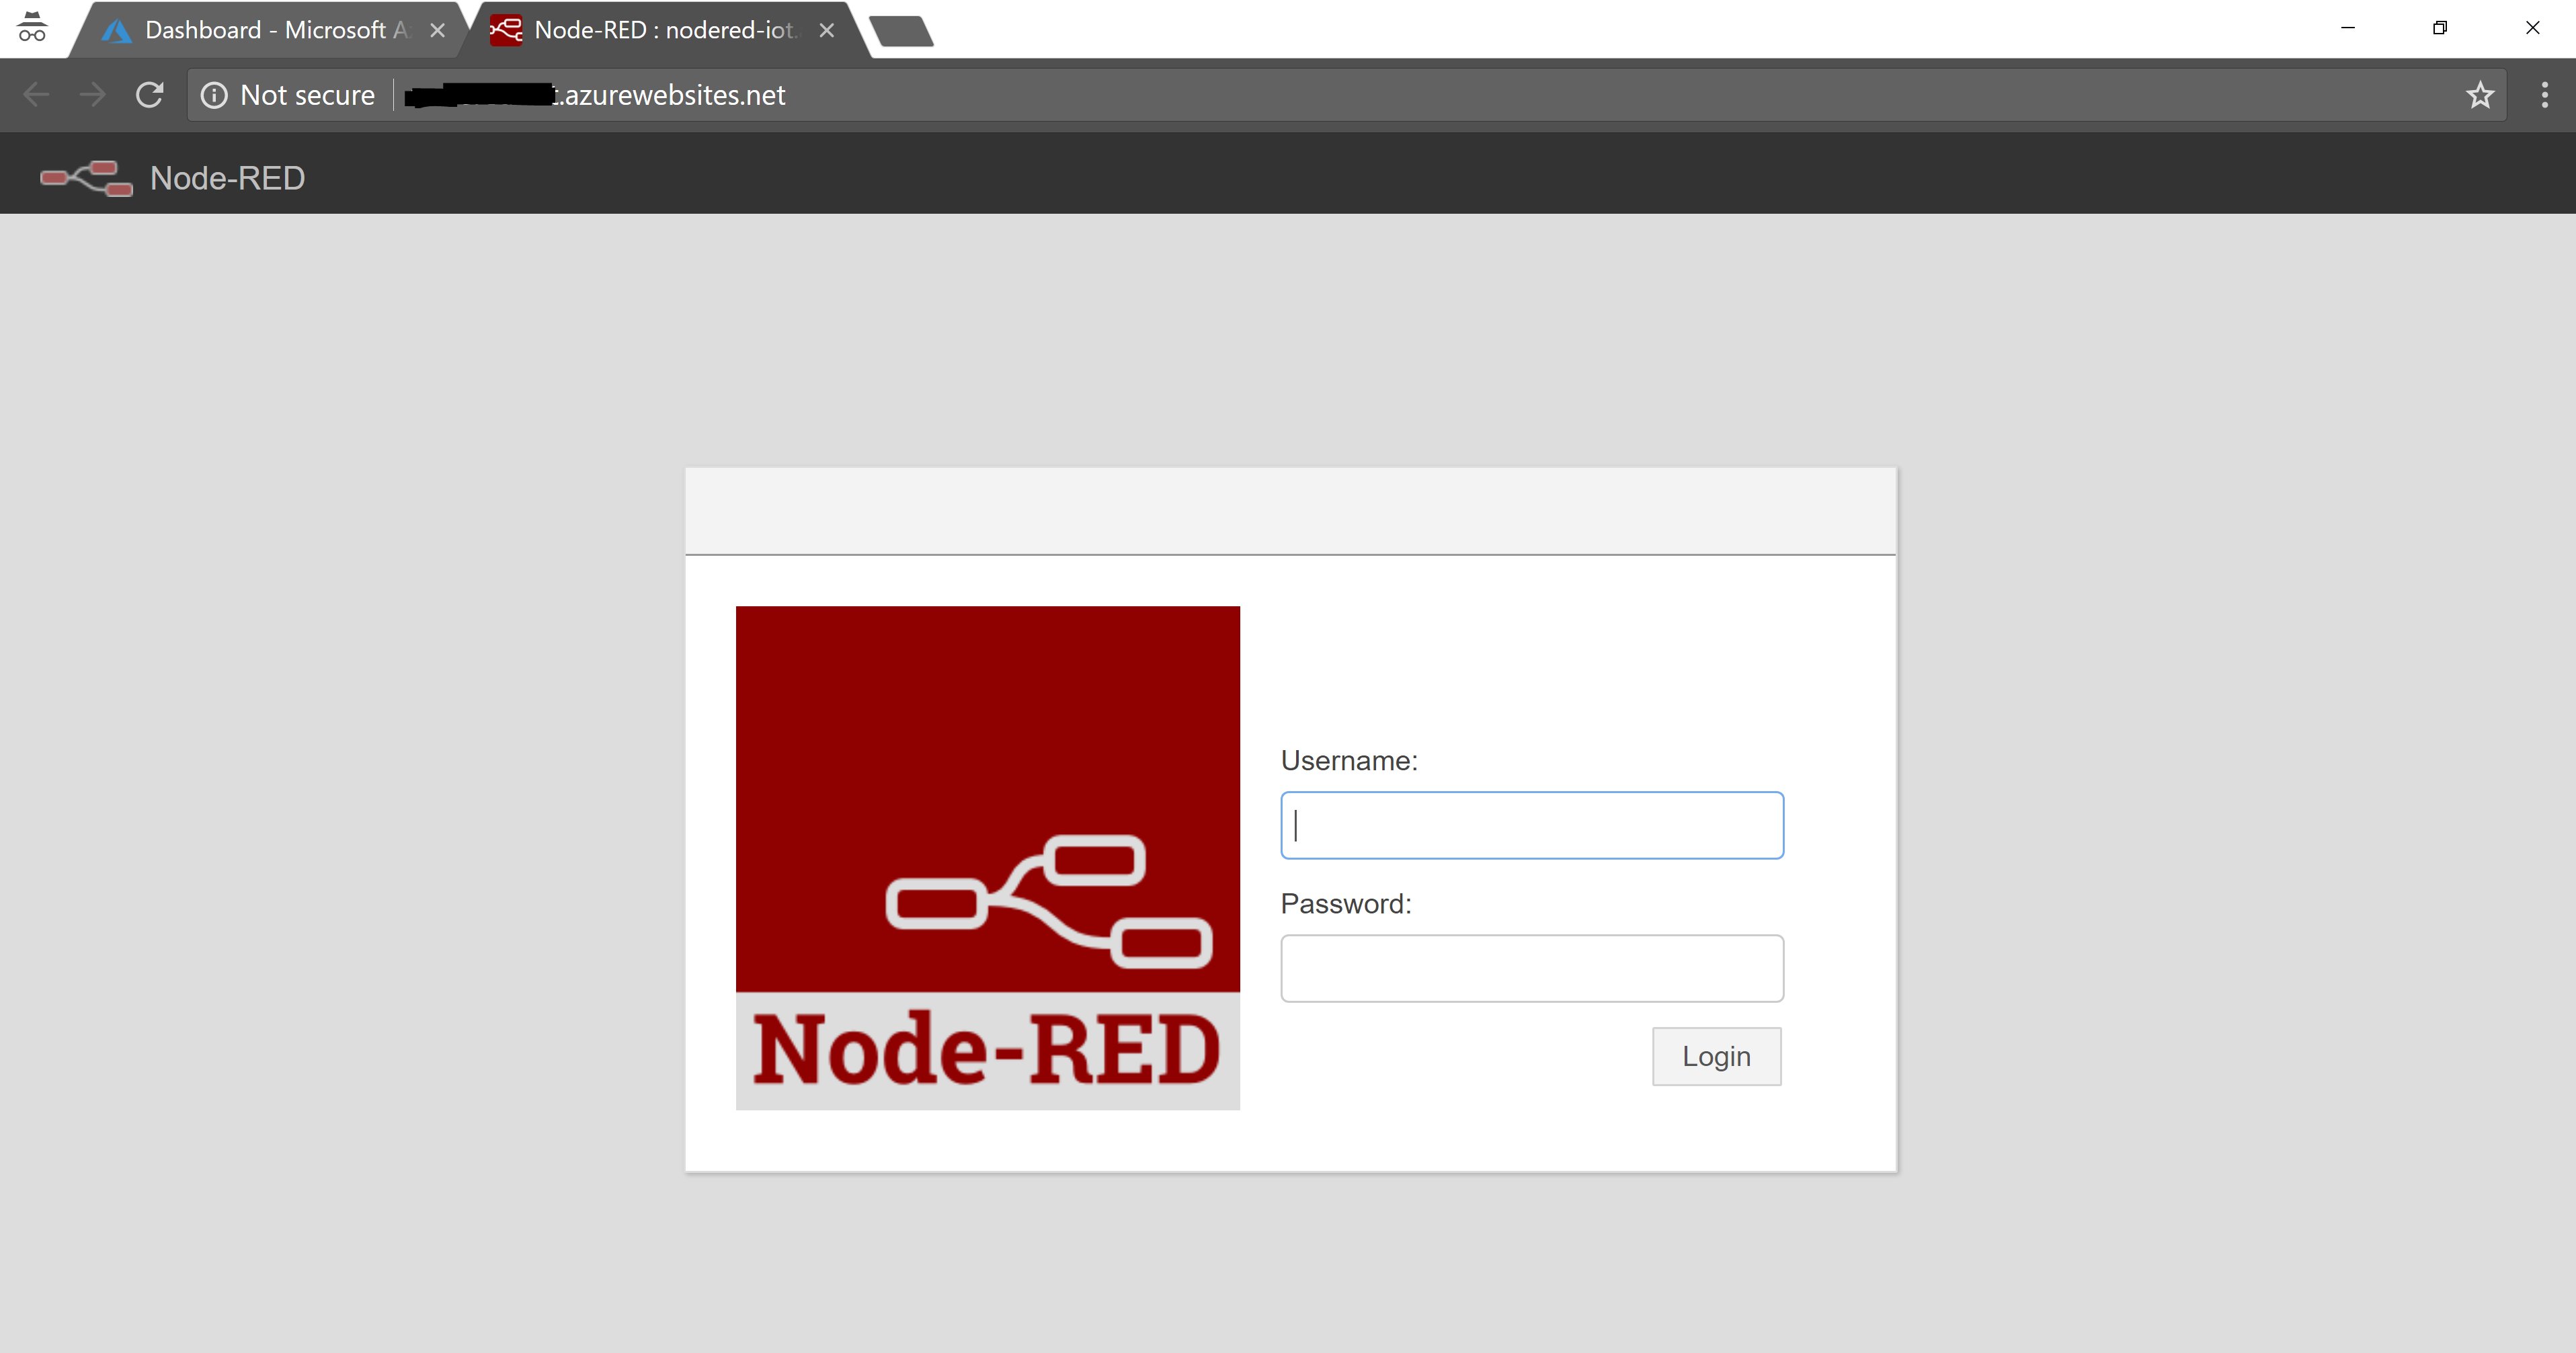
On loading your WebApp again you will be prompted to login. Login and lets get started.
Configuring Node-RED
Now it is time to pull in some data and visualise it. I’m not going to go into too much detail as what you want to do is probably quick different to me.
At its simplest though I want to trigger on a timer a call to my sensor API’s to return the values and display them as either text, a graph or a gauge. Below graphically shows he configuration for the dashboard shown above.
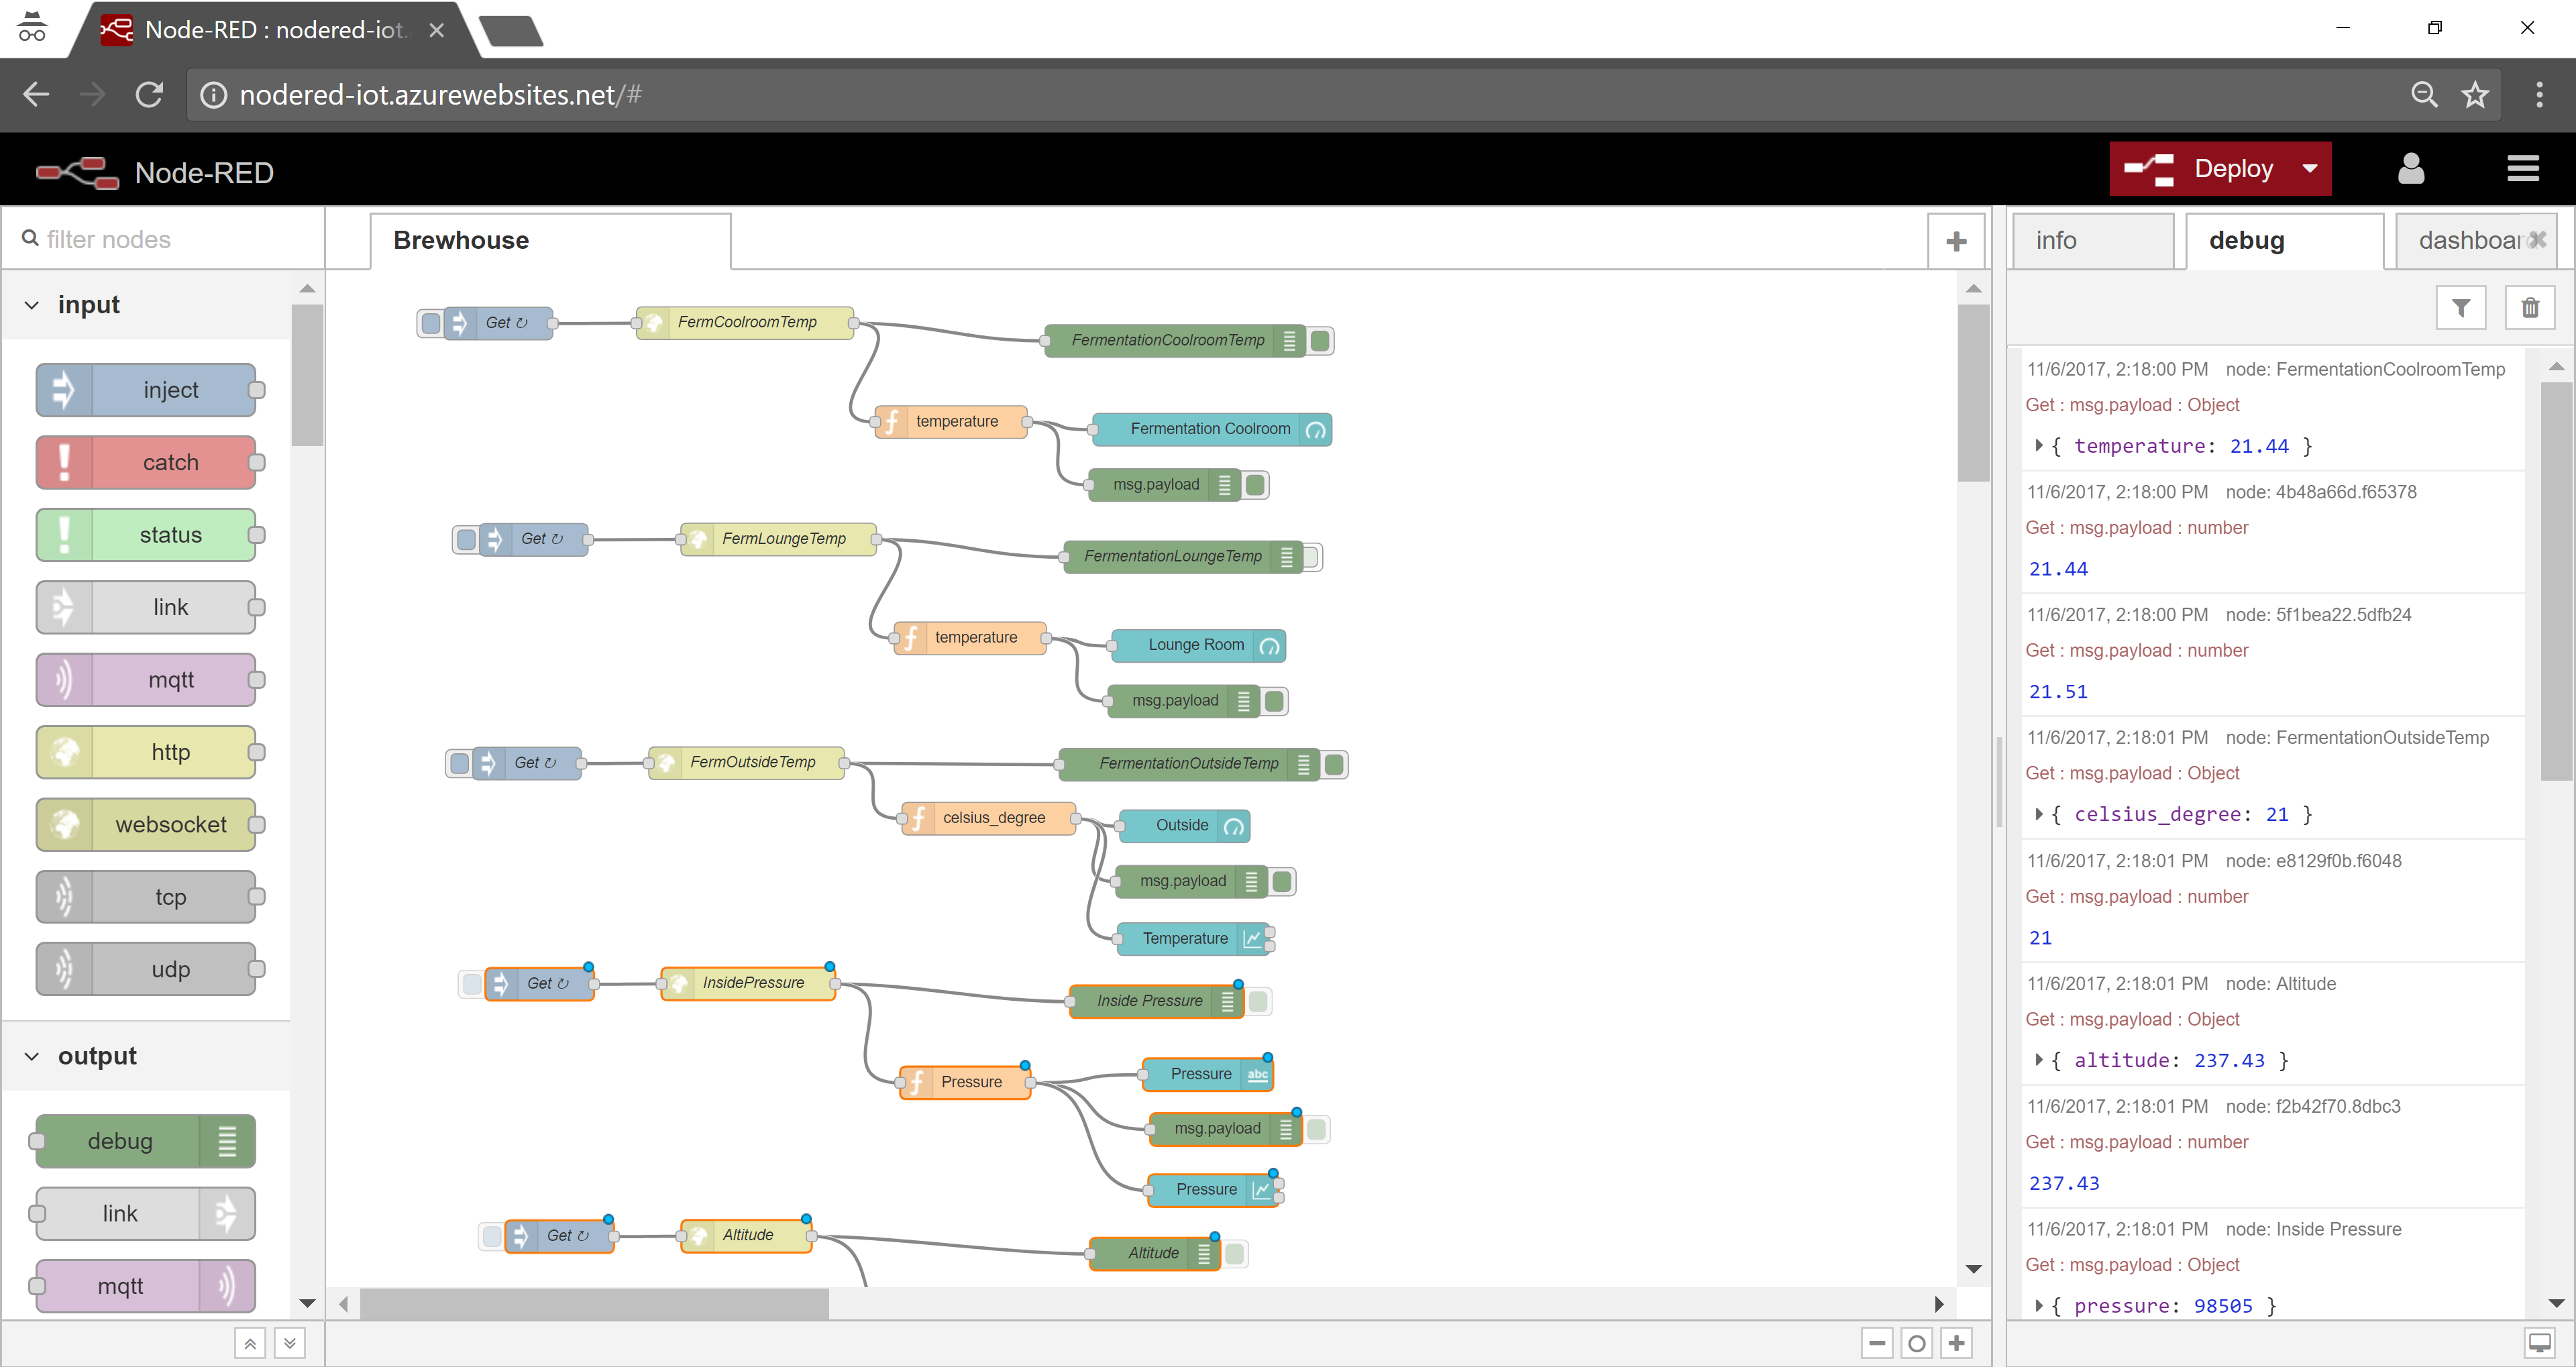
For each entity on the dashboard there is and input. For me this is trigger every 15 minutes. That looks like this.

Next is the API to get the data. The API I’m calling is an open GET with the API key in the URL so looks like this.

With the JSON response from the API I retrieve the temperature value and return it as msg for use in the UI.

I then have the Gauge for Temperature. I’ve set the minimum and maximum values and gone with the defaults for the colours.

I’m also outputting debug info during setup for the raw response from the Function ….

….. and from the parsed function.

These appear in the Debug pane on the right hand side.

After each configuration change simply select Deploy and then switch over to your Node-RED WebApp. That will looks like your URI for your WebApp with UI on the end eg. http://.azurewebsites.net/ui
Conclusion
Thanks to Azure PaaS services and the ability to use a graphical IoT tool like Node-RED we can quickly deploy a solution to visualise IoT data without having to deploy any backend infrastructure. The only hardware is the IoT sensors, everything else is serverless.
