Almost 15 years ago Microsoft released Microsoft Identity Integration Server (MIIS) 2003. Microsoft also released a couple of Resource Toolkits for MIIS to assist customers and IT Integrators’ implement the product as up to that time it’s predecessor (Microsoft Metadirectory Services) was only available as part of a Microsoft Consulting engagement.
At the same time Microsoft provided a Beta product – Microsoft PolyArchy Server. For someone who’s brain is wired in highly visually way, this was a wow moment. PolyArchy Server took a dataset from the Synchronisation Server and wrapped a small IIS website around it to expose intersecting relationships between data. When you selected a datapoint the visual would flip to the new context and display a list of entities associated with that relationship.
Microsoft proposed to deliver PolyArchy Server in calendar year 2006. However the product never made it to market. The concept of visualizing identity data was seeded in my brain and something I’ve always surfaced in one method or another as part of many Identity Management projects.
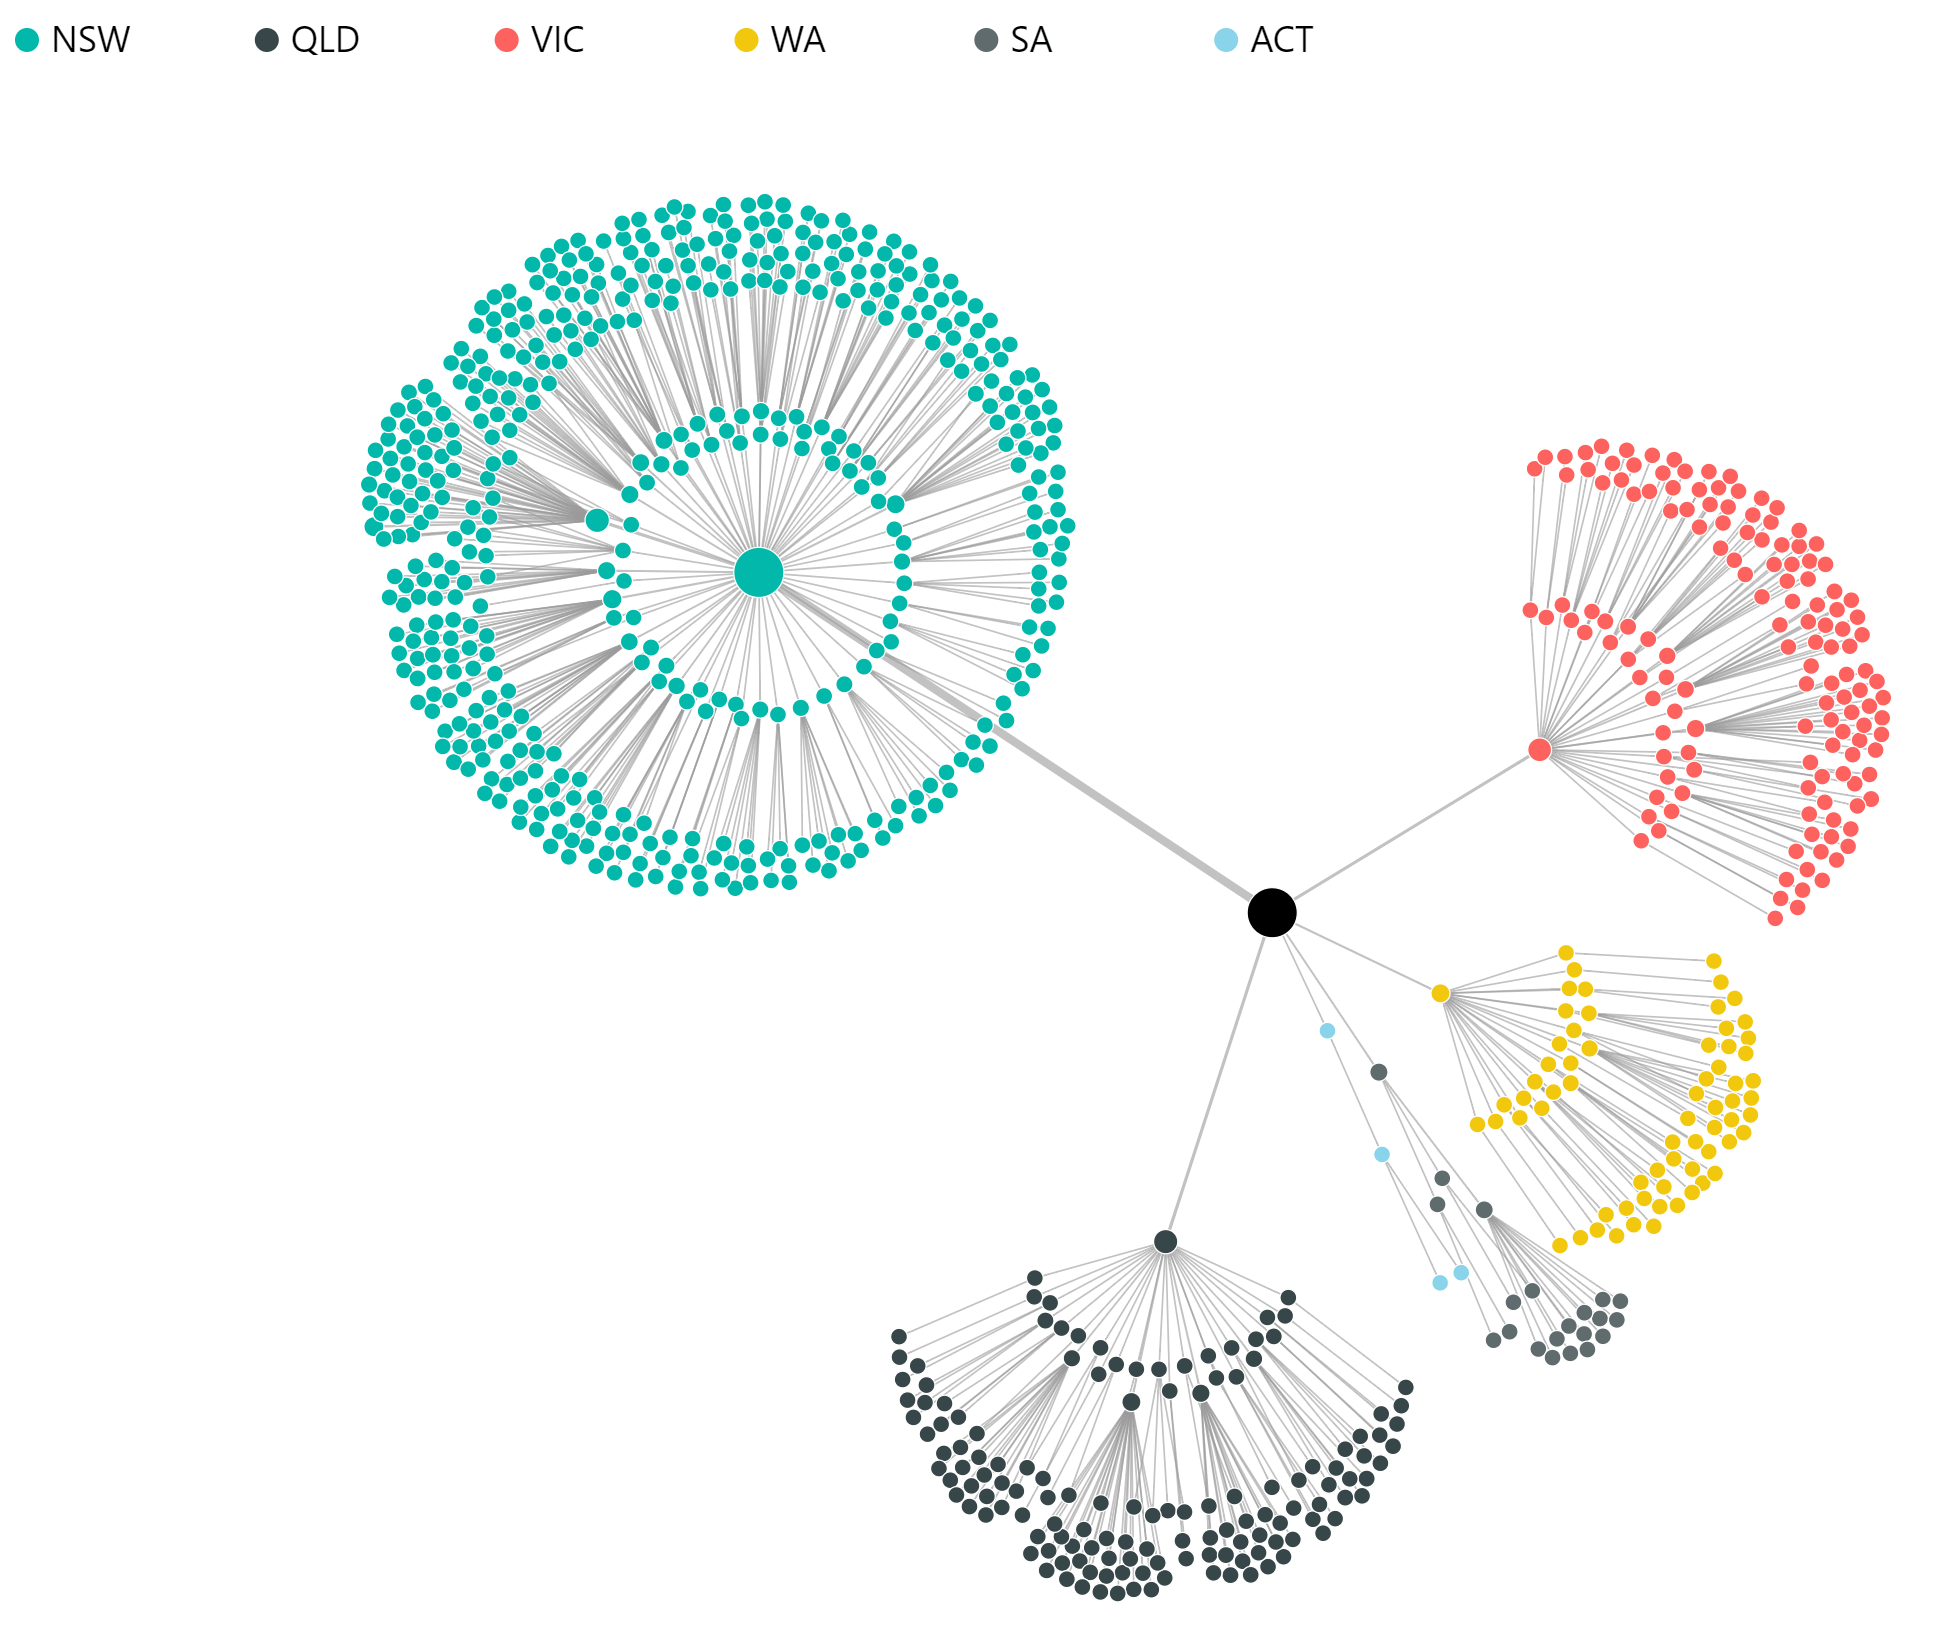
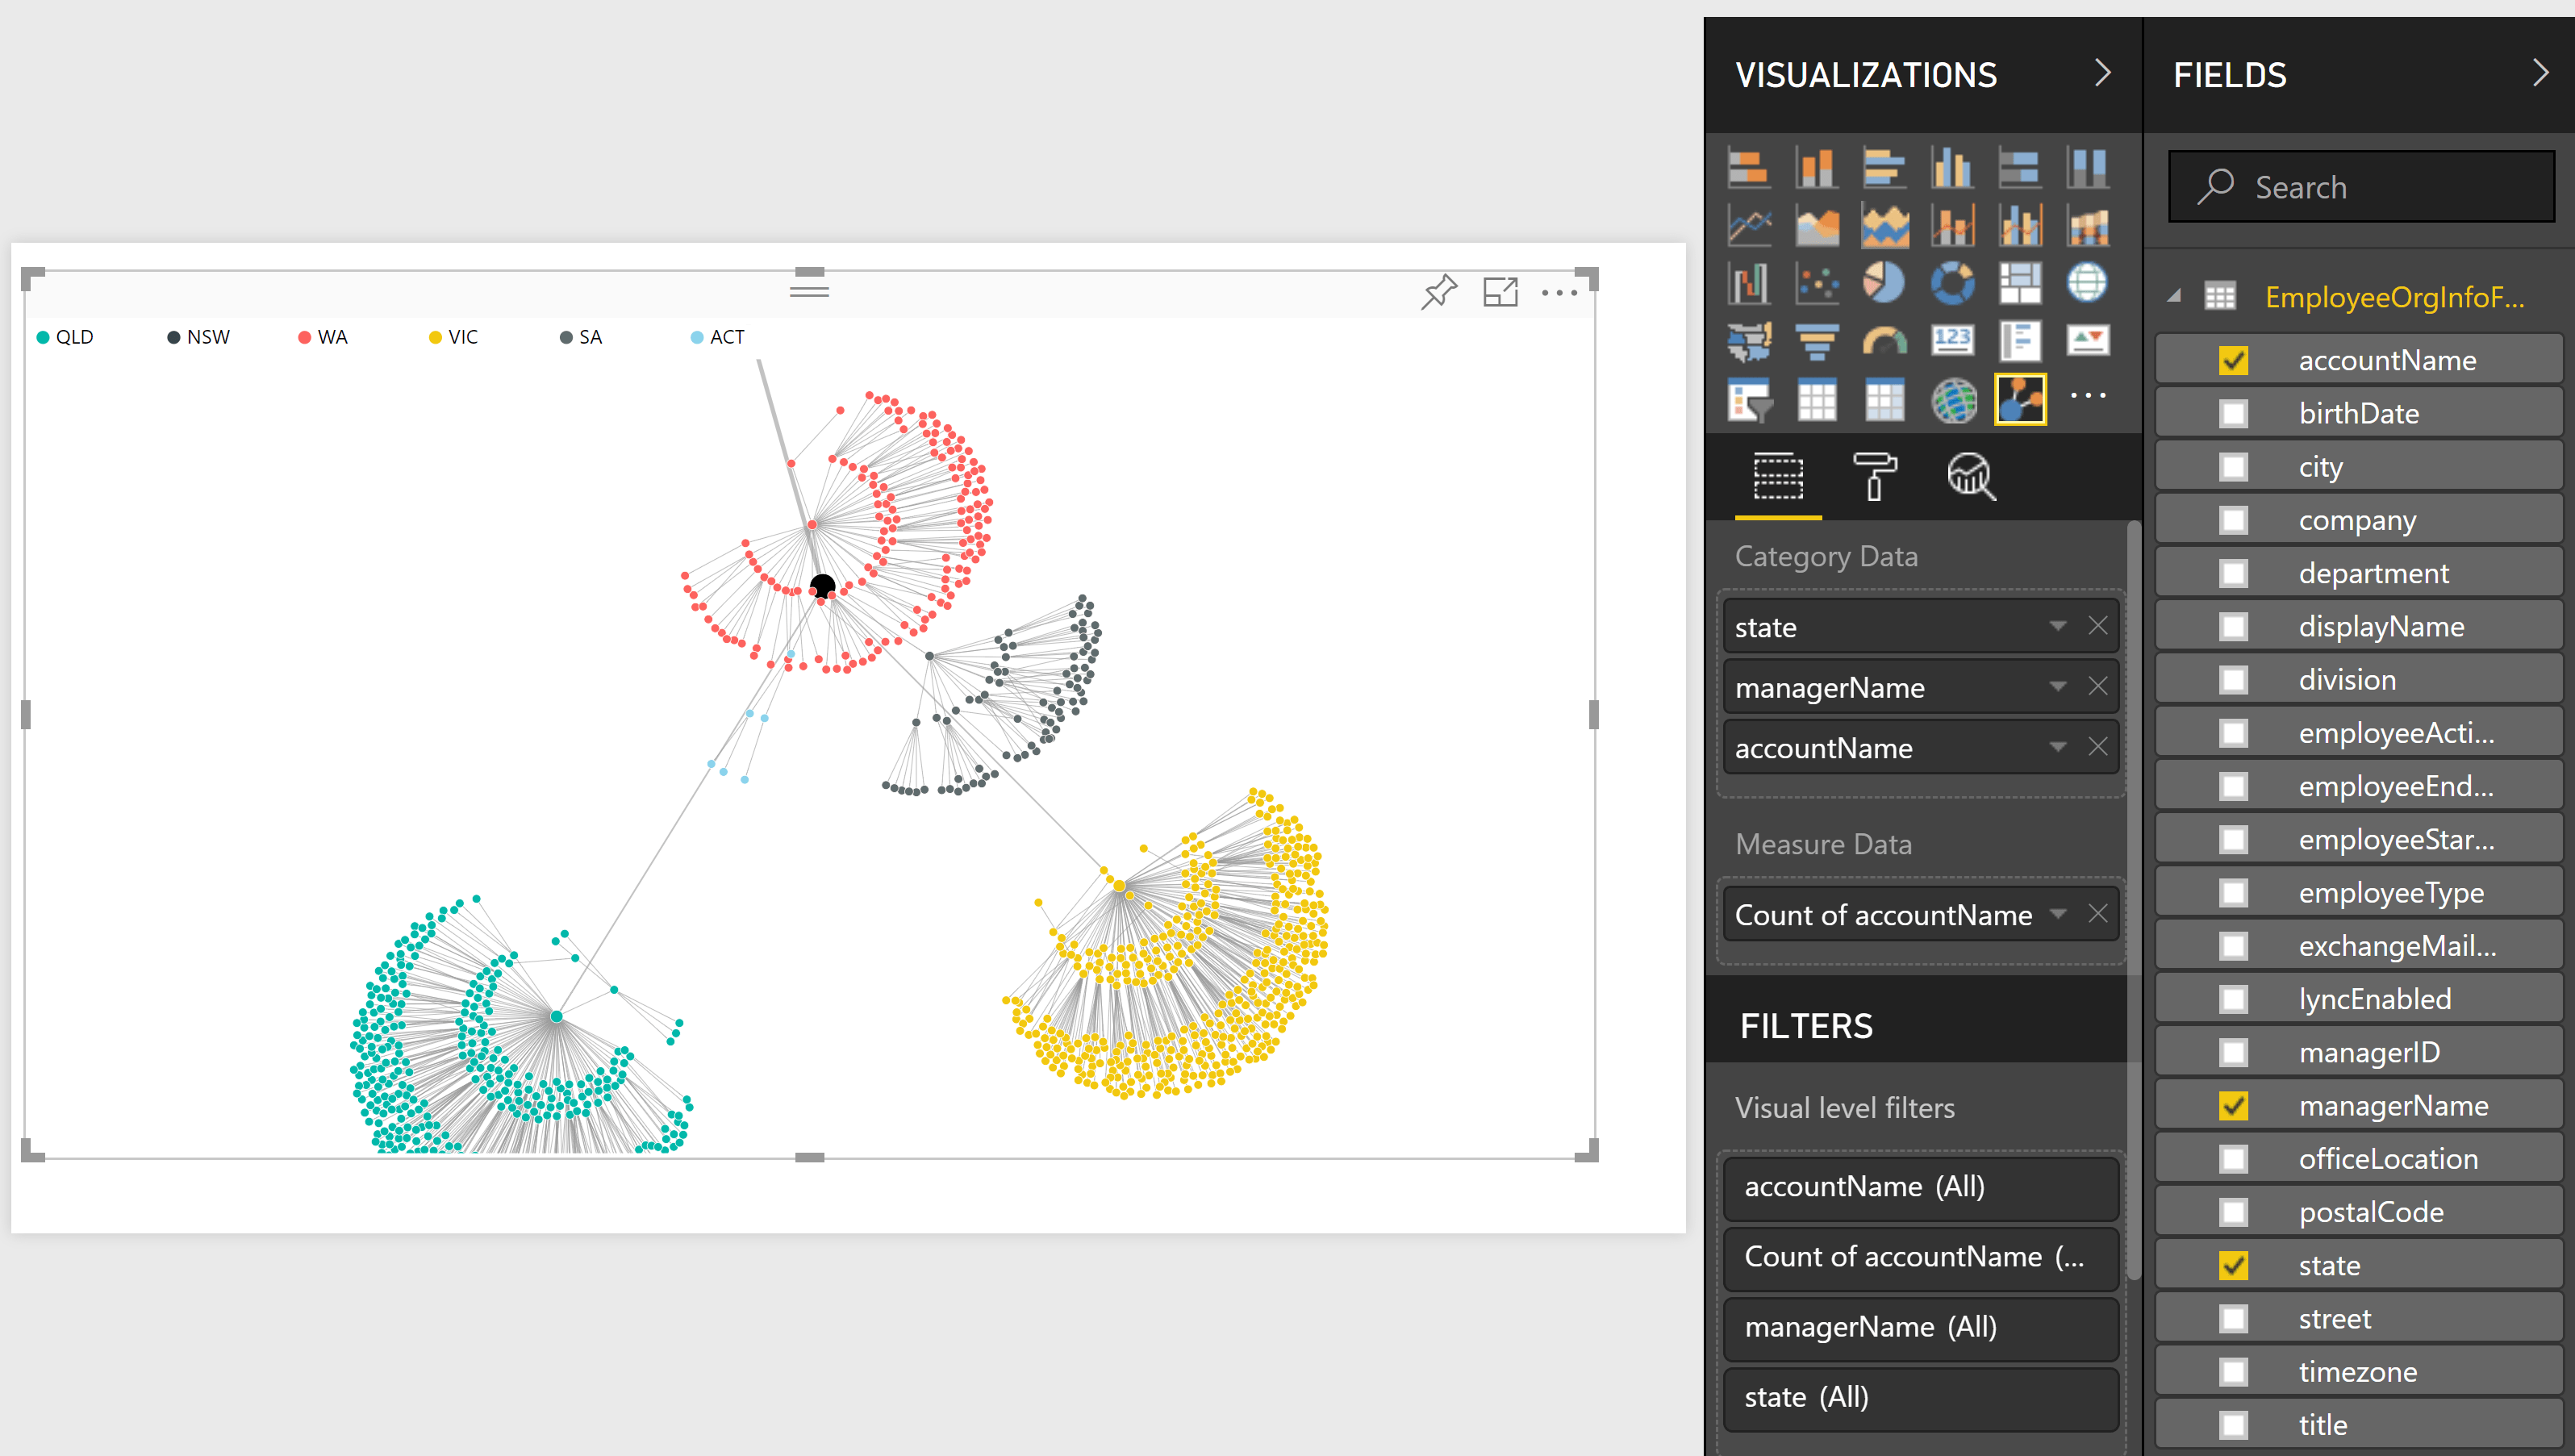
In this post I’ll detail how I’ve recently used Power BI to visualize relationship data from Microsoft Identity Manager. The graphic below is an example (with node labels turned off) that represents Managers by Department by State.
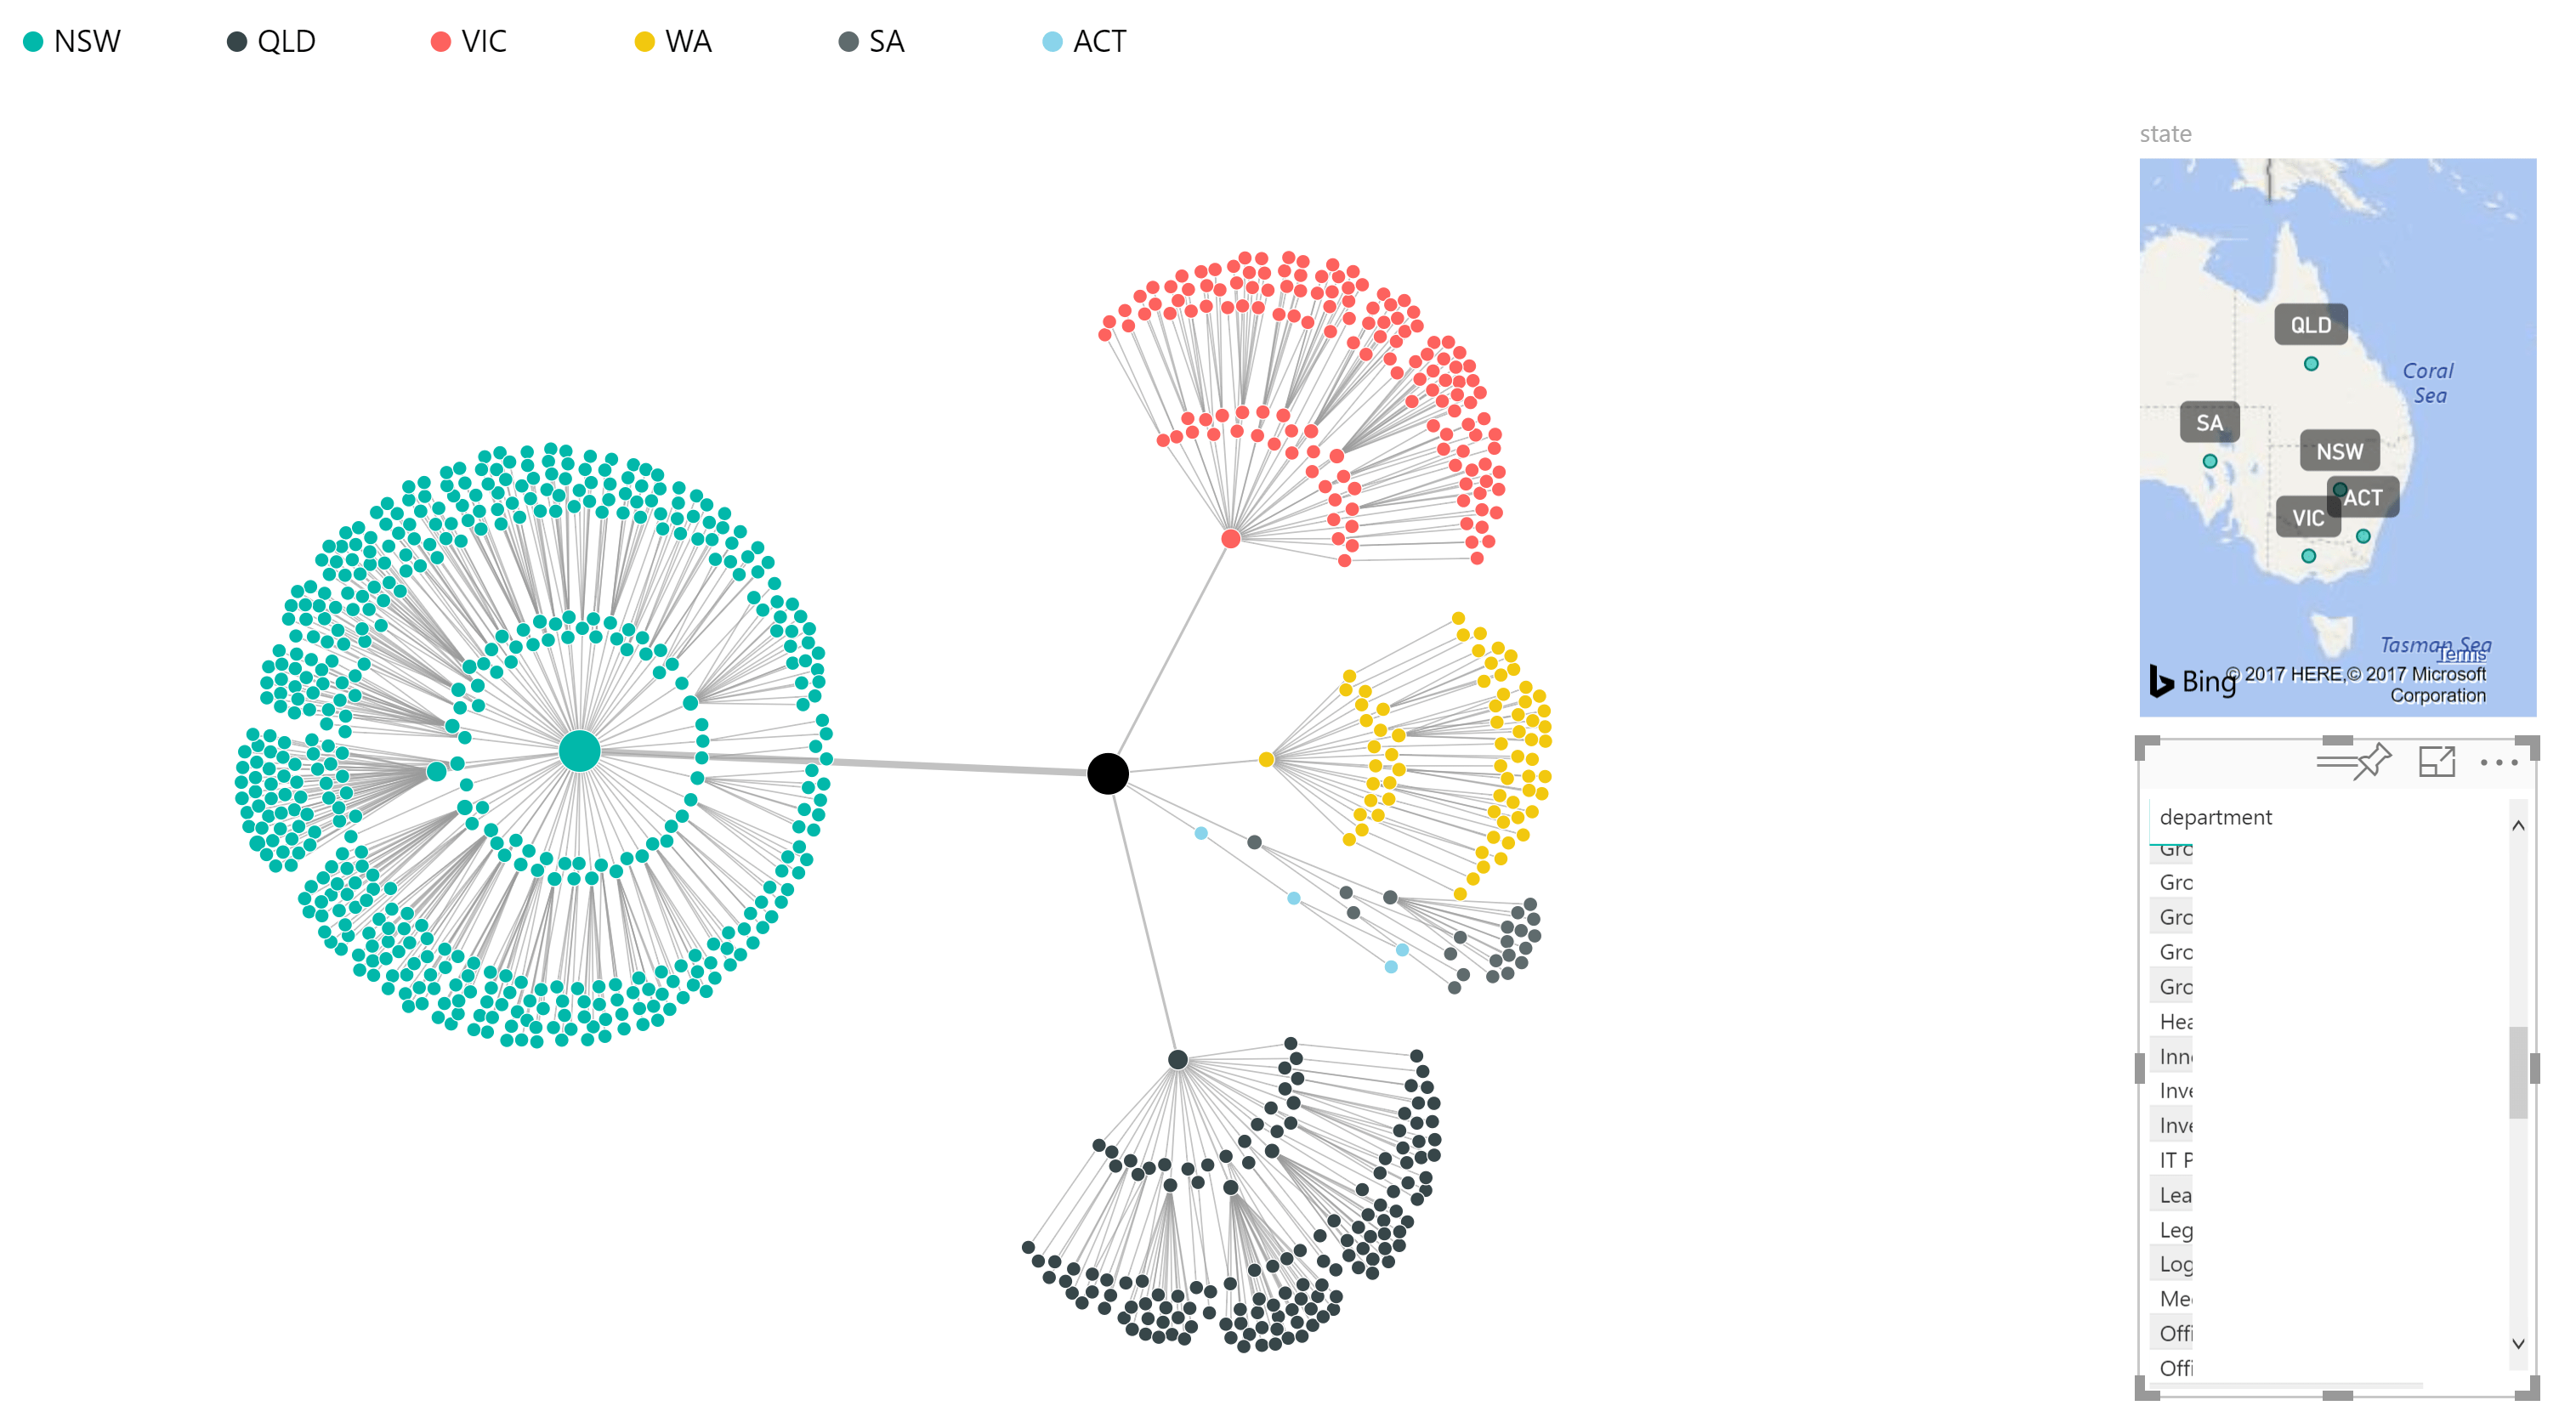
Using filters in the same report allows whoever is viewing the report to refine the visual based on State and Dept. By selecting a State from the map the visual will dynamically update to show that state only. Selecting a department only will show that department in each state.
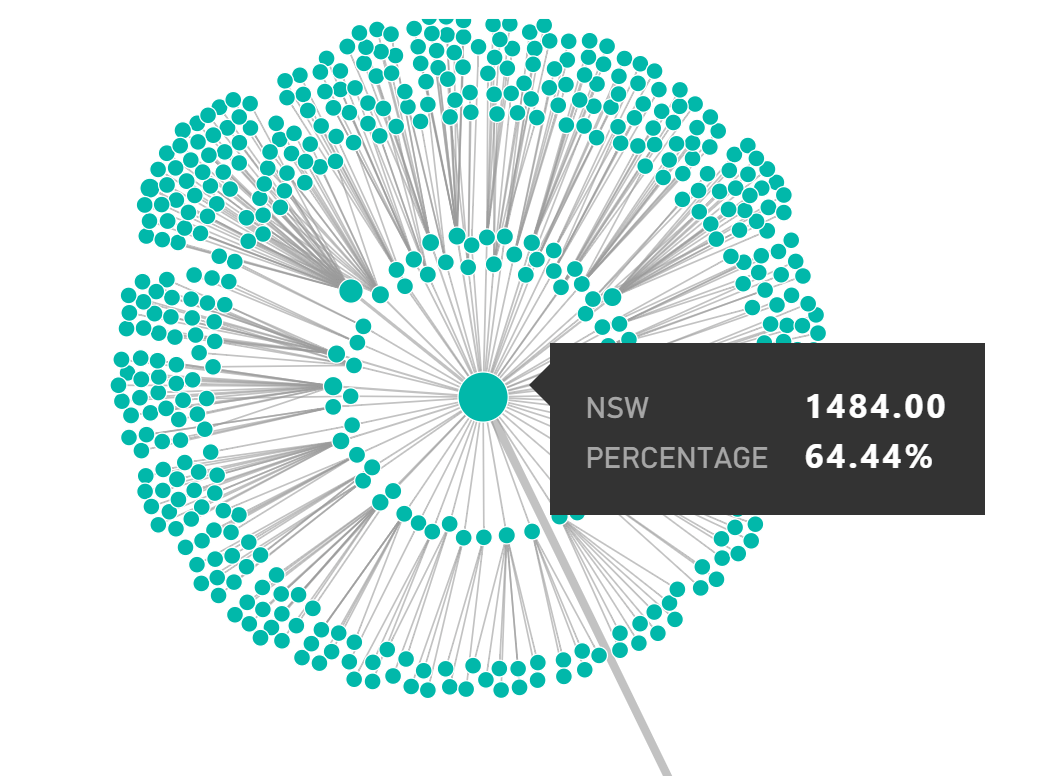
Hovering over the nodes will display the detail. I’ve turned off the node labels that show each nodes label to not expose the source of my dataset.
My recent post here details the necessary steps to get started publishing data directly in a Power BI Dataset using PowerShell. Follow the details listed there to register a Power BI Application.
With that done the script below will create a DataSet in Power BI. My dataset is obviously specific to the environment I developed it in. You probably won’t have some of the attributes so you will need to update accordingly. The script is desinged to run on the MIM Sync Server. The MIM Sync Server will need to be able to connect to Azure and Power BI.
Now that we have a Power BI DataSet (Table) we need to extract the data from the MIM MV and push it into the table. Using the Lithnet MIIS Automation PowerShell Module makes this extremely simple. Using the table schema created above I retrieve the values for each Active User, build a PowerShell Object and use the Power BI PowerShell Module to push the data to Power BI.
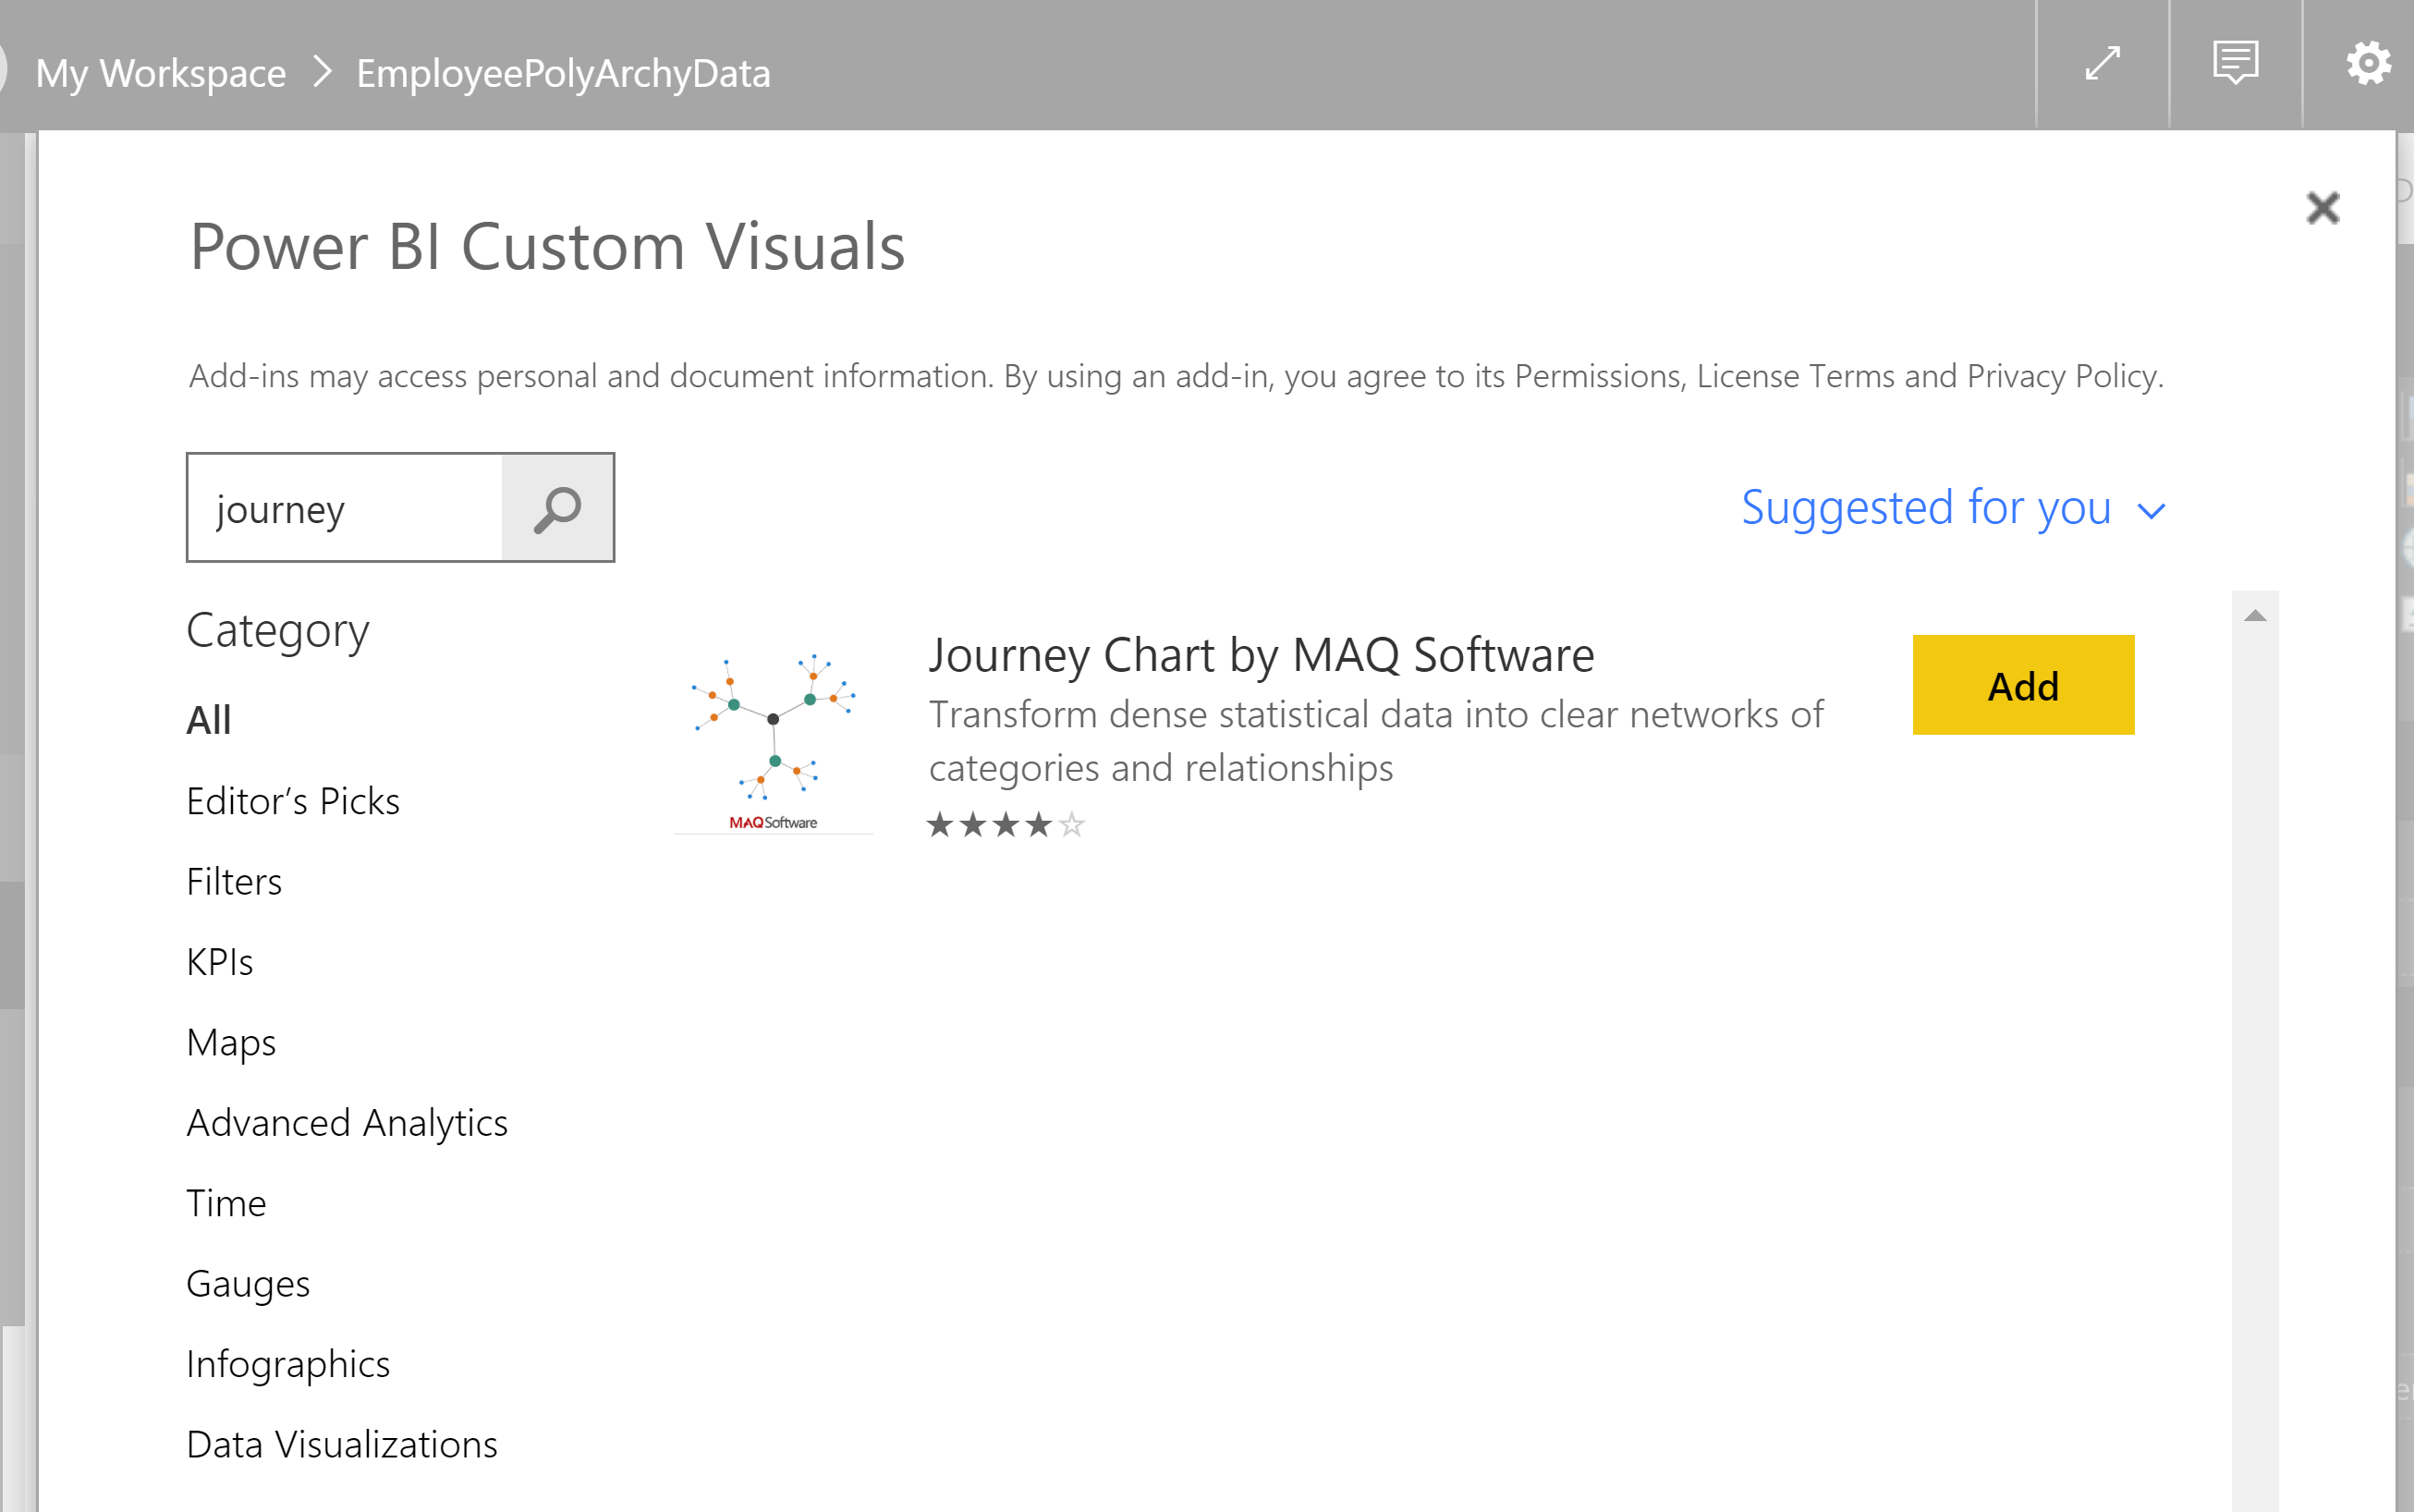
The visualisation I’m using is the Journey Chart by MAQ Software which is available in the Power BI Store (free).
With the Journey Visualization selected and dropped in we just have to select the attributes we want to visualize and the order of the relationships. The screenshot below shows the data sorted by State => managerName => accountName with Measure Data being accountName.
We never got PolyArchy Server from Microsoft, but we can quickly visualize basic relationship data from MIM with Power BI.
Automate the update of the data into Power BI, embed the Power BI Reports into your MIM Portal and provide access to the appropriate personnel.
If you've ever needed to debug a Microsoft Entra (Azure AD) authentication flow, you'll know…
It’s 2026 and somehow I keep finding myself back in 2016, integrating heritage applications into…
I’ve just published an MCP server that turns Merill & Joshua’s weekly Entra News newsletter…
If you've ever worked with the ECMA2Host for Entra Outbound Provisioning you'll be immediately presented…
For over a decade, the Granfeldt PowerShell Management Agent (PSMA) has been the bedrock for…
Recently under the experimental Azure Functions build Microsoft Developer Advocates have shown enabling Azure Functions…
This website uses cookies.
View Comments